Run more effective meetings by tracking the percentage of Issues solved. Compare this week's rate with the prior week to measure productivity. Our new Issues dashboard will have people ready to engage in discussions that lead to resolving more Issues in your meetings.
Reasons to Love the New Issue Dashboard
If you find you’re having trouble getting through your Issues, you’ll soon see how this update will maximize time in future meetings. This feature lets you track the “Issues solved” performance on a weekly basis, enabling the team to set a standard for future meetings. Perhaps best of all, it compels people to be fully prepared for the meeting and promotes accountability for continuous improvement.
Why It Matters
A few facts to share:- An estimated $37 billion is lost per year to unproductive meetings.
- Individual team members spend an average of 31 hours per month in unproductive meetings.
- From 2020 to 2021 alone, the number of meetings attended by workers has increased by 12.9%.
Nobody wants to waste time or resources, right? Our Issue Dashboard can help.
How It Works
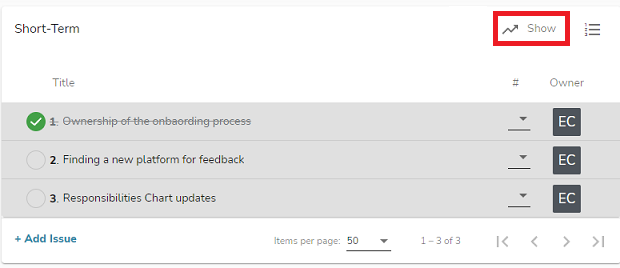
Navigate to the Short-Term Issues list for your standing weekly meeting. You'll see a new option for "![]() Show" on the right side.
Show" on the right side.
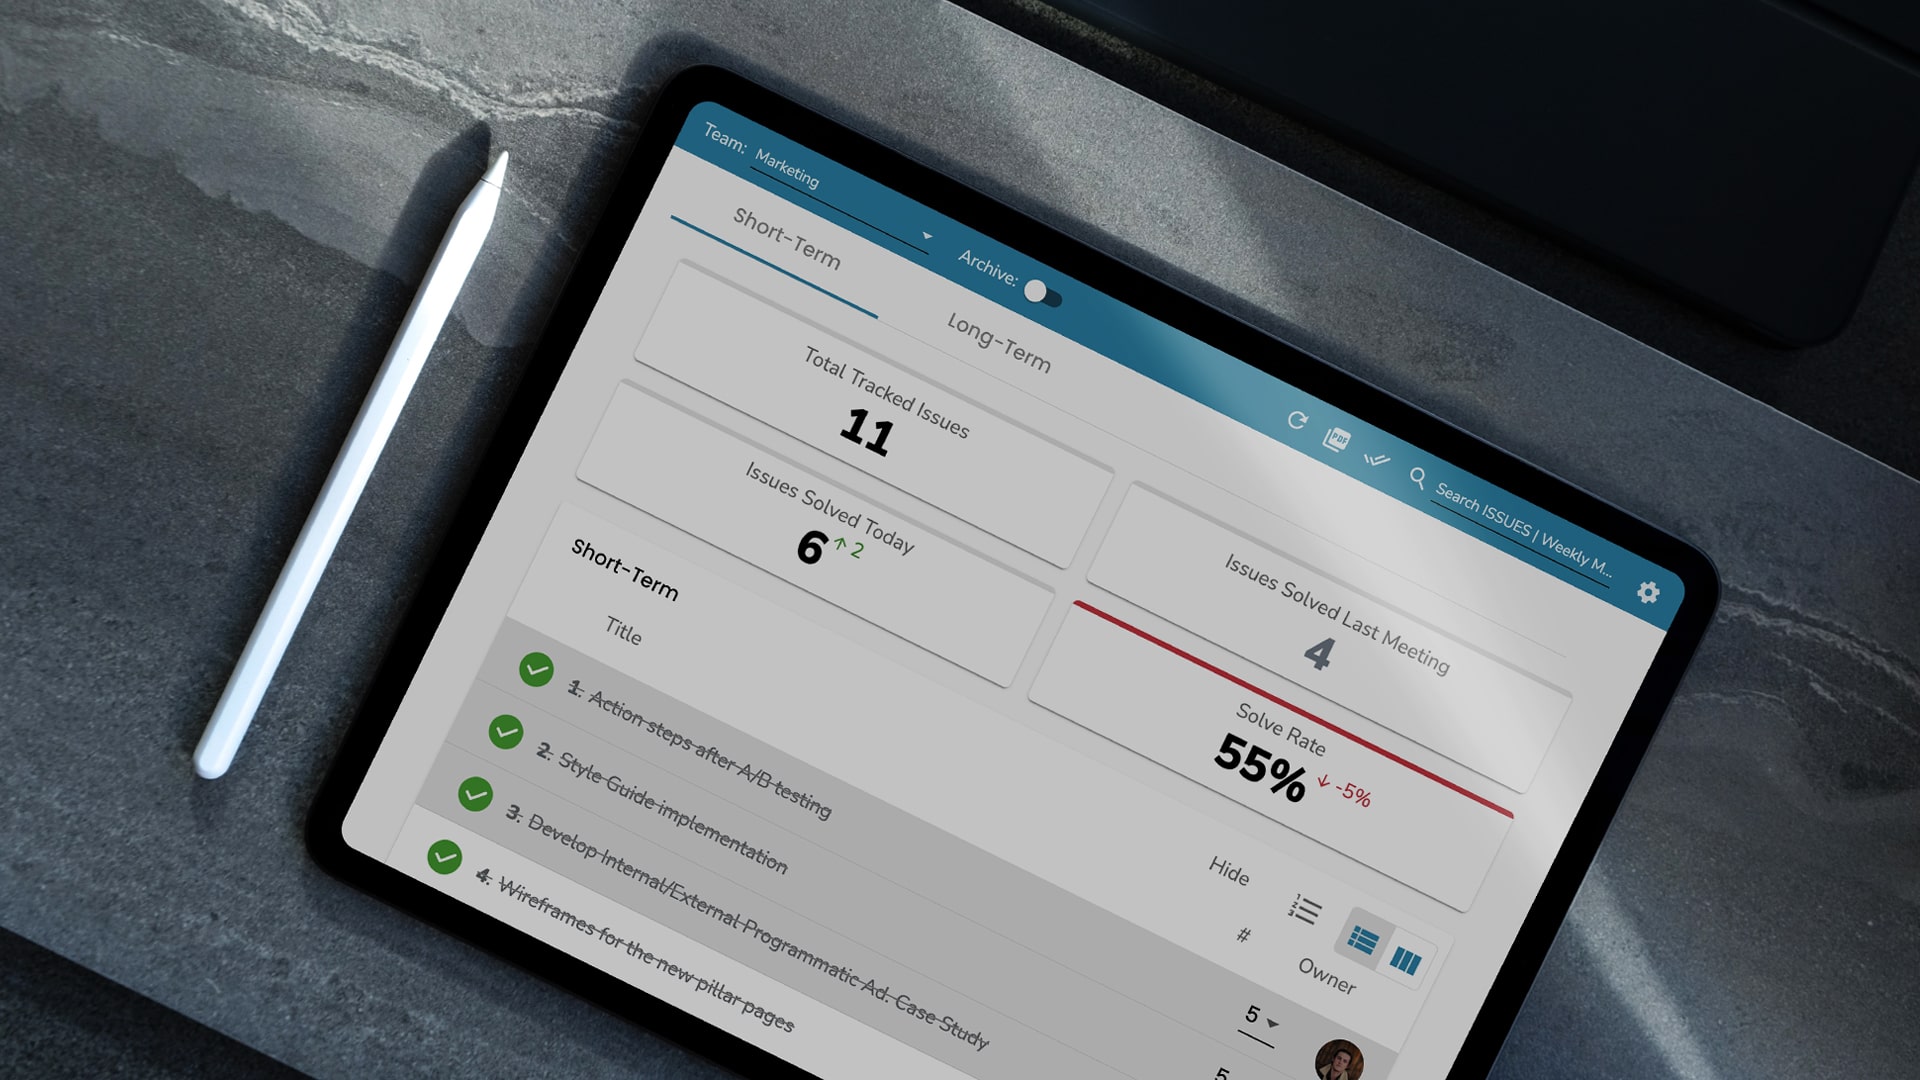
The Issue Dashboard shows the team:
- Total tracked Issues for this team
- Total Issues solved last meeting
- Total Issues solved in the current meeting, with an indicator showing the difference from the previous meeting
- Solve rate percentage for the current meeting, with an indicator against the solve rate goal
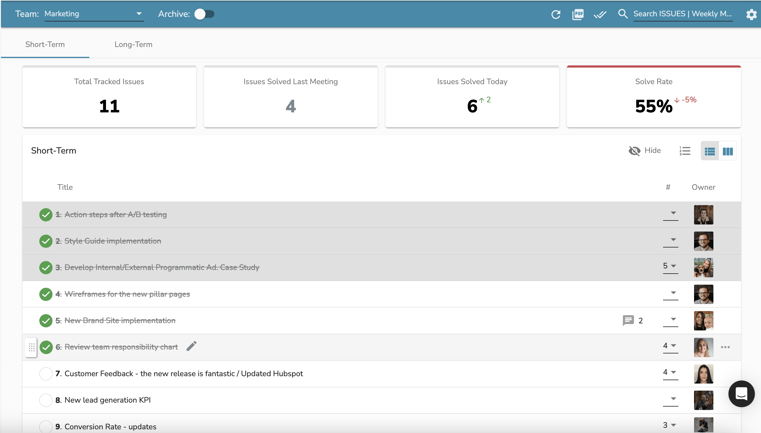
![]() TIP: While you can hide this feature, setting goals certainly motivates your team to resolve more Issues. You’ll run more efficient meetings by setting goals around your agenda items.
TIP: While you can hide this feature, setting goals certainly motivates your team to resolve more Issues. You’ll run more efficient meetings by setting goals around your agenda items.
More Features
Set different solve rates for meetings with different teams. Some teams tackle smaller problems, so it makes sense to adjust your target solve rate.
.gif?width=692&height=313&name=ezgif-4-2e57058d96%20(1).gif)
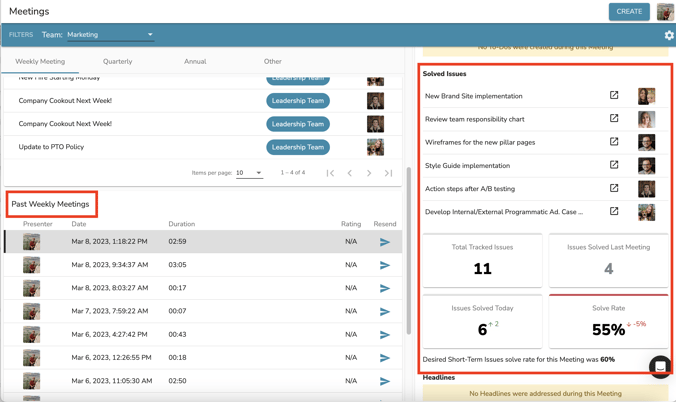
The meeting recap email includes the “Issues solved” data for team members who couldn’t attend.
You can also review a previous meeting's Issue data by reviewing the details on the Meetings tool.